
|
OAS Dashboard
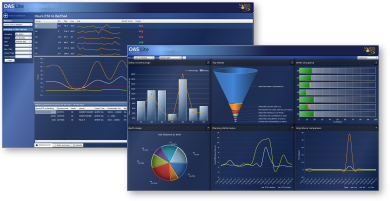 OAS Dashboard provides an integrated, visual presentation of performance measures that quickly and transparently allows clients to identify correlations and data outliers to detect and correct trends before they become an issue.
It allows the investigation of historic data trends with the ability to filter and group KPI data to pinpoint specific issues and drill down to the actual shipments that impacted the specific KPI or measure.
The dashboard is User configurable to customise which KPI controls are displayed for a given user. Some example KPI’s includes :-
- Demurrage
- Delays
- Berth Occupancy
- Liftings
- Ship\Shore Comparison & Loss
- Pumping Rates
- Stock Summary
OAS Reporting
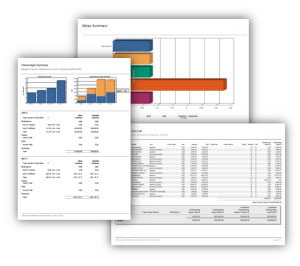 OAS provides a rich set of standard reports which cover areas including Planning, Operations, Performance/Demurrage and Stocks.
Reports can viewed directly on screen or scheduled for generation and export to a number of output formats including Excel, Word and PDF.
In addition to the standard reports, clients can also easily develop their own custom reports (using standard industry tools) which can be fully integrated into OAS to benefit from the built-in security, scheduling, and export facilities.